> ## Documentation Index
> Fetch the complete documentation index at: https://scorecard-d65b5e8a-update-playground-docs.mintlify.site/llms.txt
> Use this file to discover all available pages before exploring further.
# Tracing: Overview
> Instrument and inspect every LLM request in minutes.
export const DarkLightImage = ({lightSrc, caption, alt, darkSrc = null, width = "1000"}) => {
const getAbsoluteUrl = src => {
if (src.startsWith('http://') || src.startsWith('https://')) {
return src;
}
const currentUrl = typeof window !== 'undefined' ? window.location.origin : '';
if (currentUrl.includes('.mintlify.app')) {
const subdomain = currentUrl.split('.')[0].replace('https://', '');
return `https://mintlify.s3.us-west-1.amazonaws.com/${subdomain}${src.startsWith('/') ? '' : '/'}${src}`;
} else if (currentUrl === 'https://docs.scorecard.io') {
return `https://mintlify.s3.us-west-1.amazonaws.com/scorecard-d65b5e8a${src.startsWith('/') ? '' : '/'}${src}`;
} else {
return `${currentUrl}${src.startsWith('/') ? '' : '/'}${src}`;
}
};
const content = <>
})
 ;
if (caption) {
return {content};
} else {
return content;
}
};
New to Scorecard? Head straight to the [Tracing Quickstart](/intro/tracing-quickstart) or jump into our ready-to-run [Google Colab notebook](https://colab.research.google.com/github/scorecard-ai/scorecard-examples/blob/main/python-jupyter-openllmetry-openai/openllmetry_openai_example.ipynb) to see traces in under 5 minutes.
LLM observability means knowing exactly what happened in every generation—latency, token usage, prompts, completions, cost, errors and more. Scorecard’s **Tracing** collects this data automatically via the open-source [OpenLLMetry](https://github.com/traceloop/openllmetry) SDK (Python & Node.js) and displays rich visualisations in the Scorecard UI.
## Why Tracing matters
* Debug long or failing requests in seconds.
* Audit prompts & completions for compliance and safety.
* Attribute quality and cost back to specific services or users.
* Feed production traffic into evaluations.
### If you call it something else
* **Observability / AI spans / request logs**: We capture standard OpenTelemetry traces and spans for LLM calls and related operations.
* **Agent runs / tools / function calls**: These appear as nested spans in the trace tree, with inputs/outputs when available.
* **Prompt/Completion pairs**: Extracted from common keys (`openinference.*`, `ai.prompt` / `ai.response`, `gen_ai.*`) so they can be turned into testcases and scored.
***
## Instrument once, capture everything
```bash Python (pip) theme={null}
pip install traceloop-sdk
```
```bash TypeScript/Node (npm) theme={null}
npm install @traceloop/node-server-sdk
```
Scorecard also supports standard OpenTelemetry (OTLP/HTTP) exporters across languages (Python, TypeScript/JS, Java, Go, .NET, Rust)—point your exporter at your Scorecard project and include your API key.
```python Python theme={null}
from traceloop.sdk import Traceloop
from traceloop.sdk.instruments import Instruments
# Initialize OpenLLMetry. Works with any supported provider (OpenAI, Anthropic, Gemini, Bedrock, etc.)
# Set scorecard.project_id to route traces to a specific project (defaults to oldest project)
Traceloop.init(
disable_batch=True,
instruments={Instruments.OPENAI},
resource_attributes={
"scorecard.project_id": ""
}
)
# Make any LLM/provider call with your client – it will be traced automatically
```
```ts TypeScript/Node theme={null}
import { Traceloop, Instruments } from '@traceloop/node-server-sdk'
// Initialize OpenLLMetry. Works with any supported provider or HTTP instrumentation
// Set scorecard.project_id to route traces to a specific project (defaults to oldest project)
Traceloop.init({
disableBatch: true,
instruments: new Set([Instruments.OPENAI]),
resourceAttributes: {
'scorecard.project_id': ''
}
})
// Make any LLM/provider call with your client – it will be traced automatically
```
See the [Quickstart](/intro/tracing-quickstart) for full environment variable setup, examples and best practices.
***
## Explore traces in Scorecard
;
if (caption) {
return {content};
} else {
return content;
}
};
New to Scorecard? Head straight to the [Tracing Quickstart](/intro/tracing-quickstart) or jump into our ready-to-run [Google Colab notebook](https://colab.research.google.com/github/scorecard-ai/scorecard-examples/blob/main/python-jupyter-openllmetry-openai/openllmetry_openai_example.ipynb) to see traces in under 5 minutes.
LLM observability means knowing exactly what happened in every generation—latency, token usage, prompts, completions, cost, errors and more. Scorecard’s **Tracing** collects this data automatically via the open-source [OpenLLMetry](https://github.com/traceloop/openllmetry) SDK (Python & Node.js) and displays rich visualisations in the Scorecard UI.
## Why Tracing matters
* Debug long or failing requests in seconds.
* Audit prompts & completions for compliance and safety.
* Attribute quality and cost back to specific services or users.
* Feed production traffic into evaluations.
### If you call it something else
* **Observability / AI spans / request logs**: We capture standard OpenTelemetry traces and spans for LLM calls and related operations.
* **Agent runs / tools / function calls**: These appear as nested spans in the trace tree, with inputs/outputs when available.
* **Prompt/Completion pairs**: Extracted from common keys (`openinference.*`, `ai.prompt` / `ai.response`, `gen_ai.*`) so they can be turned into testcases and scored.
***
## Instrument once, capture everything
```bash Python (pip) theme={null}
pip install traceloop-sdk
```
```bash TypeScript/Node (npm) theme={null}
npm install @traceloop/node-server-sdk
```
Scorecard also supports standard OpenTelemetry (OTLP/HTTP) exporters across languages (Python, TypeScript/JS, Java, Go, .NET, Rust)—point your exporter at your Scorecard project and include your API key.
```python Python theme={null}
from traceloop.sdk import Traceloop
from traceloop.sdk.instruments import Instruments
# Initialize OpenLLMetry. Works with any supported provider (OpenAI, Anthropic, Gemini, Bedrock, etc.)
# Set scorecard.project_id to route traces to a specific project (defaults to oldest project)
Traceloop.init(
disable_batch=True,
instruments={Instruments.OPENAI},
resource_attributes={
"scorecard.project_id": ""
}
)
# Make any LLM/provider call with your client – it will be traced automatically
```
```ts TypeScript/Node theme={null}
import { Traceloop, Instruments } from '@traceloop/node-server-sdk'
// Initialize OpenLLMetry. Works with any supported provider or HTTP instrumentation
// Set scorecard.project_id to route traces to a specific project (defaults to oldest project)
Traceloop.init({
disableBatch: true,
instruments: new Set([Instruments.OPENAI]),
resourceAttributes: {
'scorecard.project_id': ''
}
})
// Make any LLM/provider call with your client – it will be traced automatically
```
See the [Quickstart](/intro/tracing-quickstart) for full environment variable setup, examples and best practices.
***
## Explore traces in Scorecard
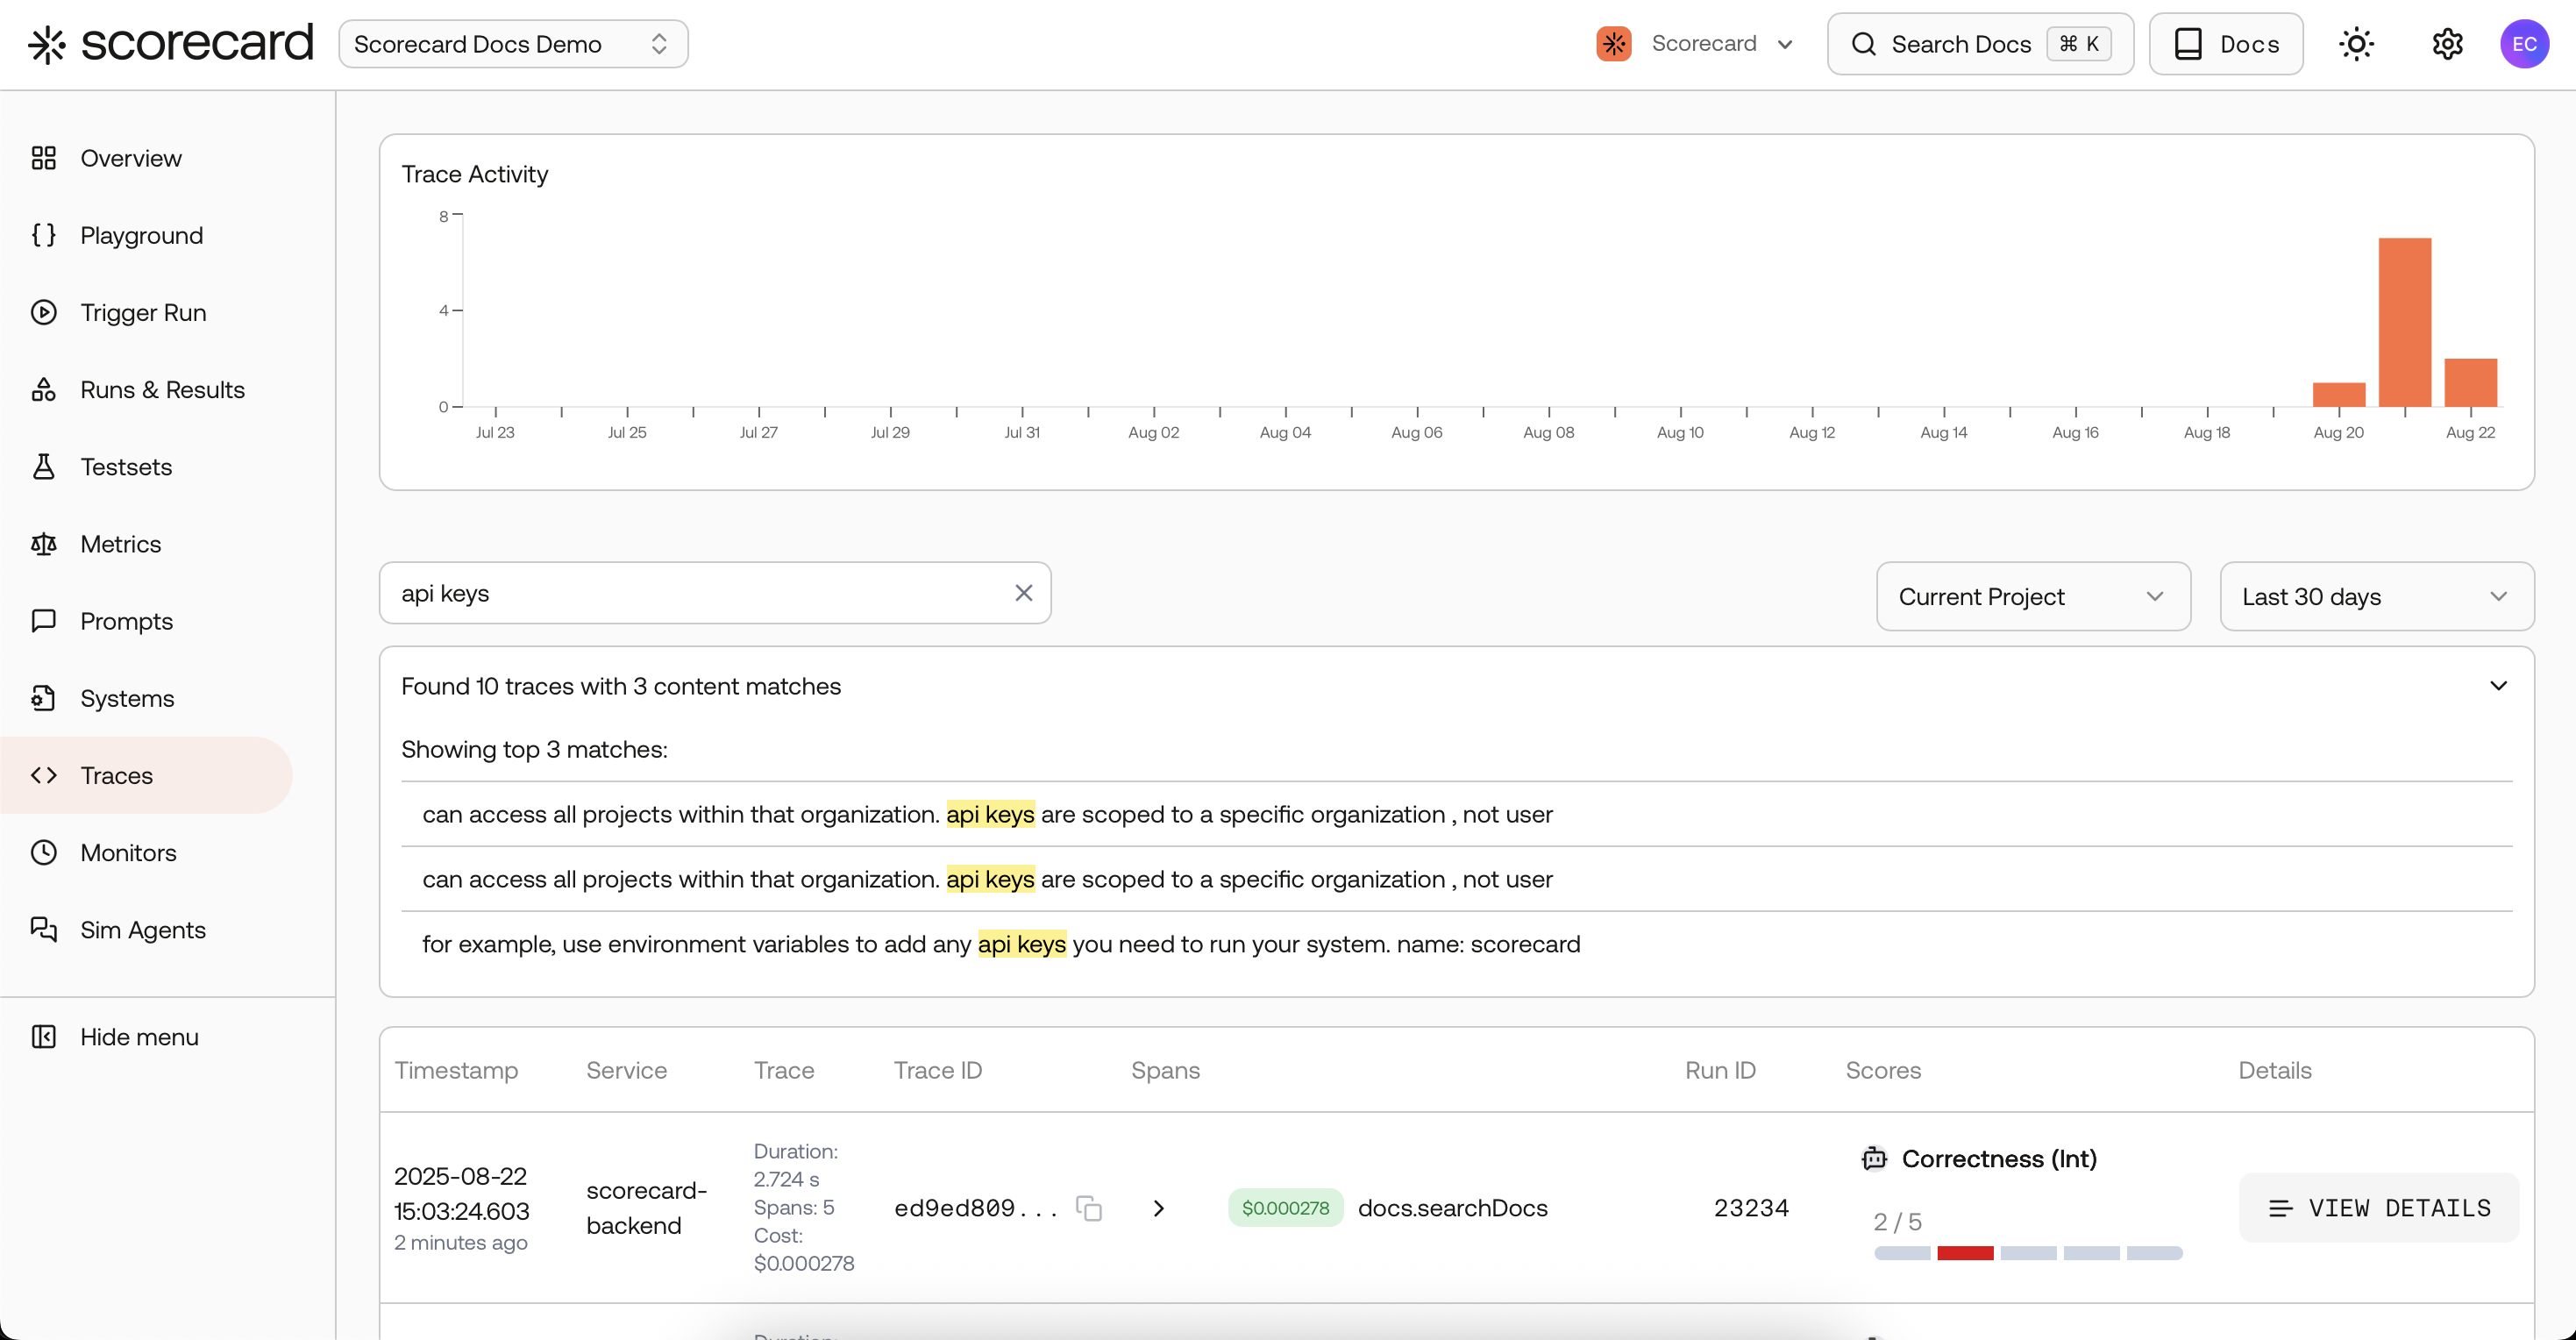 Scorecard automatically groups spans into traces and surfaces:
* **Timestamp & duration** – when and how long the request ran.
* **Service & span tree** – navigate nested function/tool calls with a collapsible span tree for easier navigation through long, highly nested traces.
* **Token & cost breakdown** – estimate spend per trace via model pricing.
* **Scores column** – if a trace links to an evaluation run the results appear inline (`TraceScoresCell`).
* **Full-text search & filters** – search any span attribute (`searchText`) or limit to a specific project/time-range.
* **Copyable Trace ID** – quickly copy and share trace identifiers.
All table controls map to URL parameters so you can share filtered trace views.
### Search & filters
* **Time ranges**: 30m, 24h, 3d, 7d, 30d, All.
* **Project scope**: toggle between Current project and All projects.
* **SearchText**: full‑text across span/resource attributes (including prompt/response fields).
* **Match previews**: quick context snippets with deep links to traces.
* **Cursor pagination**: efficient browsing with shareable URLs.
***
## Trace Grouping
When running batch operations or multi-step workflows, you can group related traces into a single run using the `scorecard.tracing_group_id` span attribute. This makes it easier to track and analyze workflows that span multiple LLM calls.
### How it works
Add the `scorecard.tracing_group_id` attribute to your spans with a shared identifier. Scorecard automatically groups spans with the same group ID into a single run.
```python Python theme={null}
from opentelemetry import trace
tracer = trace.get_tracer(__name__)
# Use the same group_id for all related operations
group_id = "batch-job-123"
with tracer.start_as_current_span("process_document") as span:
span.set_attribute("scorecard.tracing_group_id", group_id)
# Your LLM call here
with tracer.start_as_current_span("summarize_results") as span:
span.set_attribute("scorecard.tracing_group_id", group_id)
# Another LLM call in the same workflow
```
```typescript TypeScript theme={null}
import { trace } from '@opentelemetry/api';
const tracer = trace.getTracer('my-service');
// Use the same groupId for all related operations
const groupId = 'batch-job-123';
const span1 = tracer.startSpan('process_document');
span1.setAttribute('scorecard.tracing_group_id', groupId);
// Your LLM call here
span1.end();
const span2 = tracer.startSpan('summarize_results');
span2.setAttribute('scorecard.tracing_group_id', groupId);
// Another LLM call in the same workflow
span2.end();
```
### Use cases
* **Batch processing**: Group all documents processed in a single batch job
* **Multi-step agents**: Track all LLM calls within an agent's execution
* **Workflows**: Link related operations across different services
* **A/B testing**: Group traces by experiment variant for comparison
Traces with the same `scorecard.tracing_group_id` will appear together in the same run, making it easy to analyze aggregate metrics across related operations.
***
## Turn traces to testcases
Live traffic exposes edge-cases synthetic datasets miss. From any span that contains prompt/response attributes click **Create Testcase** and Scorecard will:
1. Extract `openinference.*`, `ai.prompt` / `ai.response`, or `gen_ai.*` fields.
2. Save the pair into a chosen **Testset**.
3. Make it immediately available for offline evaluation runs.
Read more in [Trace to Testcase](/features/trace-to-testcase).
***
## AI-Specific Error Detection
Scorecard's tracing goes beyond technical failures to detect AI-specific behavioral issues that traditional observability misses. The system acts as an always-on watchdog, analyzing every AI interaction to catch both obvious technical errors and subtle behavioral problems that could impact user experience.
### Silent Failure Detection
The most dangerous errors in AI systems are "silent failures" where your AI responds but incorrectly. Scorecard automatically detects behavioral errors including off-topic responses, workflow interruptions, safety violations, hallucinations, and context loss. These silent failures often go unnoticed without specialized AI observability but can severely impact user trust and application effectiveness.
Technical errors like rate limits, timeouts, and API failures are captured automatically through standard trace error recording. However, AI applications also face unique challenges like semantic drift, safety policy violations, factual accuracy issues, and task completion failures that require intelligent analysis beyond traditional error logging.
### Custom Error Detection
Create custom metrics through Scorecard's UI to detect application-specific behavioral issues. Design AI-powered metrics that analyze trace data for off-topic responses, safety violations, or task completion failures. These custom metrics automatically evaluate your traces and surface problematic interactions that would otherwise go unnoticed in production.
***
## Supported Frameworks & Providers
Scorecard traces LLM applications built with popular open-source frameworks through [OpenLLMetry](https://github.com/traceloop/openllmetry). OpenLLMetry provides automatic instrumentation for:
### Application Frameworks
* **CrewAI** – Multi-agent collaboration
* **Haystack** – Search and question-answering pipelines
* **LangChain** – Chains, agents, and tool calls
* **Langflow** – Visual workflow builder
* **LangGraph** – Multi-step workflows and state machines
* **LiteLLM** – Unified interface for 100+ LLMs
* **LlamaIndex** – RAG pipelines and document retrieval
* **[OpenAI Agents SDK](https://github.com/openai/openai-agents-python?tab=readme-ov-file#tracing)** – Assistants API and function calling
* **[Vercel AI SDK](https://ai-sdk.dev/providers/observability/scorecard)** – Full-stack AI applications
Scorecard is featured as a recommended observability provider in the official [Vercel AI SDK documentation](https://ai-sdk.dev/providers/observability/scorecard) and [OpenAI Agents Python README](https://github.com/openai/openai-agents-python?tab=readme-ov-file#tracing).
### LLM Providers
* Aleph Alpha
* Anthropic
* AWS Bedrock
* AWS SageMaker
* Azure OpenAI
* Cohere
* Google Gemini
* Google Vertex AI
* Groq
* HuggingFace
* IBM Watsonx AI
* Mistral AI
* Ollama
* OpenAI
* Replicate
* Together AI
* and more
### Vector Databases
* Chroma
* LanceDB
* Marqo
* Milvus
* Pinecone
* Qdrant
* Weaviate
For the complete list of supported integrations, see the [OpenLLMetry repository](https://github.com/traceloop/openllmetry). All integrations are built on OpenTelemetry standards and maintained by the community.
### Custom Providers
For frameworks or providers not listed above, you can use:
* **HTTP Instrumentation**: OpenLLMetry's `instrument_http()` for HTTP-based APIs
* **Manual Spans**: Emit custom OpenTelemetry spans for proprietary systems
See the [OpenLLMetry documentation](https://www.traceloop.com/docs/openllmetry/getting-started-python) for manual instrumentation guides.
***
## Use cases
* **Production observability for LLM quality and safety**
* **Debugging slow/failed requests with full span context**
* **Auditing prompts/completions for compliance**
* **Attributing token cost and latency to services/cohorts**
* **Building evaluation datasets from real traffic (Trace to Testcase)**
***
## Next steps
1. Follow the [Quickstart](/intro/tracing-quickstart) to send your first trace.
2. Open the [Colab notebook](https://colab.research.google.com/github/scorecard-ai/scorecard-examples/blob/main/python-jupyter-openllmetry-openai/openllmetry_openai_example.ipynb) for an interactive tour.
3. Convert live traffic to evaluations with [Trace to Testcase](/features/trace-to-testcase).
Happy tracing! 🚀
Scorecard automatically groups spans into traces and surfaces:
* **Timestamp & duration** – when and how long the request ran.
* **Service & span tree** – navigate nested function/tool calls with a collapsible span tree for easier navigation through long, highly nested traces.
* **Token & cost breakdown** – estimate spend per trace via model pricing.
* **Scores column** – if a trace links to an evaluation run the results appear inline (`TraceScoresCell`).
* **Full-text search & filters** – search any span attribute (`searchText`) or limit to a specific project/time-range.
* **Copyable Trace ID** – quickly copy and share trace identifiers.
All table controls map to URL parameters so you can share filtered trace views.
### Search & filters
* **Time ranges**: 30m, 24h, 3d, 7d, 30d, All.
* **Project scope**: toggle between Current project and All projects.
* **SearchText**: full‑text across span/resource attributes (including prompt/response fields).
* **Match previews**: quick context snippets with deep links to traces.
* **Cursor pagination**: efficient browsing with shareable URLs.
***
## Trace Grouping
When running batch operations or multi-step workflows, you can group related traces into a single run using the `scorecard.tracing_group_id` span attribute. This makes it easier to track and analyze workflows that span multiple LLM calls.
### How it works
Add the `scorecard.tracing_group_id` attribute to your spans with a shared identifier. Scorecard automatically groups spans with the same group ID into a single run.
```python Python theme={null}
from opentelemetry import trace
tracer = trace.get_tracer(__name__)
# Use the same group_id for all related operations
group_id = "batch-job-123"
with tracer.start_as_current_span("process_document") as span:
span.set_attribute("scorecard.tracing_group_id", group_id)
# Your LLM call here
with tracer.start_as_current_span("summarize_results") as span:
span.set_attribute("scorecard.tracing_group_id", group_id)
# Another LLM call in the same workflow
```
```typescript TypeScript theme={null}
import { trace } from '@opentelemetry/api';
const tracer = trace.getTracer('my-service');
// Use the same groupId for all related operations
const groupId = 'batch-job-123';
const span1 = tracer.startSpan('process_document');
span1.setAttribute('scorecard.tracing_group_id', groupId);
// Your LLM call here
span1.end();
const span2 = tracer.startSpan('summarize_results');
span2.setAttribute('scorecard.tracing_group_id', groupId);
// Another LLM call in the same workflow
span2.end();
```
### Use cases
* **Batch processing**: Group all documents processed in a single batch job
* **Multi-step agents**: Track all LLM calls within an agent's execution
* **Workflows**: Link related operations across different services
* **A/B testing**: Group traces by experiment variant for comparison
Traces with the same `scorecard.tracing_group_id` will appear together in the same run, making it easy to analyze aggregate metrics across related operations.
***
## Turn traces to testcases
Live traffic exposes edge-cases synthetic datasets miss. From any span that contains prompt/response attributes click **Create Testcase** and Scorecard will:
1. Extract `openinference.*`, `ai.prompt` / `ai.response`, or `gen_ai.*` fields.
2. Save the pair into a chosen **Testset**.
3. Make it immediately available for offline evaluation runs.
Read more in [Trace to Testcase](/features/trace-to-testcase).
***
## AI-Specific Error Detection
Scorecard's tracing goes beyond technical failures to detect AI-specific behavioral issues that traditional observability misses. The system acts as an always-on watchdog, analyzing every AI interaction to catch both obvious technical errors and subtle behavioral problems that could impact user experience.
### Silent Failure Detection
The most dangerous errors in AI systems are "silent failures" where your AI responds but incorrectly. Scorecard automatically detects behavioral errors including off-topic responses, workflow interruptions, safety violations, hallucinations, and context loss. These silent failures often go unnoticed without specialized AI observability but can severely impact user trust and application effectiveness.
Technical errors like rate limits, timeouts, and API failures are captured automatically through standard trace error recording. However, AI applications also face unique challenges like semantic drift, safety policy violations, factual accuracy issues, and task completion failures that require intelligent analysis beyond traditional error logging.
### Custom Error Detection
Create custom metrics through Scorecard's UI to detect application-specific behavioral issues. Design AI-powered metrics that analyze trace data for off-topic responses, safety violations, or task completion failures. These custom metrics automatically evaluate your traces and surface problematic interactions that would otherwise go unnoticed in production.
***
## Supported Frameworks & Providers
Scorecard traces LLM applications built with popular open-source frameworks through [OpenLLMetry](https://github.com/traceloop/openllmetry). OpenLLMetry provides automatic instrumentation for:
### Application Frameworks
* **CrewAI** – Multi-agent collaboration
* **Haystack** – Search and question-answering pipelines
* **LangChain** – Chains, agents, and tool calls
* **Langflow** – Visual workflow builder
* **LangGraph** – Multi-step workflows and state machines
* **LiteLLM** – Unified interface for 100+ LLMs
* **LlamaIndex** – RAG pipelines and document retrieval
* **[OpenAI Agents SDK](https://github.com/openai/openai-agents-python?tab=readme-ov-file#tracing)** – Assistants API and function calling
* **[Vercel AI SDK](https://ai-sdk.dev/providers/observability/scorecard)** – Full-stack AI applications
Scorecard is featured as a recommended observability provider in the official [Vercel AI SDK documentation](https://ai-sdk.dev/providers/observability/scorecard) and [OpenAI Agents Python README](https://github.com/openai/openai-agents-python?tab=readme-ov-file#tracing).
### LLM Providers
* Aleph Alpha
* Anthropic
* AWS Bedrock
* AWS SageMaker
* Azure OpenAI
* Cohere
* Google Gemini
* Google Vertex AI
* Groq
* HuggingFace
* IBM Watsonx AI
* Mistral AI
* Ollama
* OpenAI
* Replicate
* Together AI
* and more
### Vector Databases
* Chroma
* LanceDB
* Marqo
* Milvus
* Pinecone
* Qdrant
* Weaviate
For the complete list of supported integrations, see the [OpenLLMetry repository](https://github.com/traceloop/openllmetry). All integrations are built on OpenTelemetry standards and maintained by the community.
### Custom Providers
For frameworks or providers not listed above, you can use:
* **HTTP Instrumentation**: OpenLLMetry's `instrument_http()` for HTTP-based APIs
* **Manual Spans**: Emit custom OpenTelemetry spans for proprietary systems
See the [OpenLLMetry documentation](https://www.traceloop.com/docs/openllmetry/getting-started-python) for manual instrumentation guides.
***
## Use cases
* **Production observability for LLM quality and safety**
* **Debugging slow/failed requests with full span context**
* **Auditing prompts/completions for compliance**
* **Attributing token cost and latency to services/cohorts**
* **Building evaluation datasets from real traffic (Trace to Testcase)**
***
## Next steps
1. Follow the [Quickstart](/intro/tracing-quickstart) to send your first trace.
2. Open the [Colab notebook](https://colab.research.google.com/github/scorecard-ai/scorecard-examples/blob/main/python-jupyter-openllmetry-openai/openllmetry_openai_example.ipynb) for an interactive tour.
3. Convert live traffic to evaluations with [Trace to Testcase](/features/trace-to-testcase).
Happy tracing! 🚀