Looking for general tracing guidance? Check out the Tracing Quickstart for an overview of tracing concepts and alternative integration methods.
Steps
Set up environment variables
Configure the Traceloop SDK to send traces to Scorecard. Get your Scorecard API key from Settings.
Replace
<your_scorecard_api_key> with your actual Scorecard API key (starts with ak_).Initialize tracing
Initialize the Traceloop SDK with LangChain instrumentation before importing LangChain modules.
Run your LangChain application
With tracing initialized, run your LangChain application. All LLM calls, chain executions, and agent actions are automatically traced.Here’s a full example:
example.py
You may see
Failed to export batch warnings in the console. These can be safely ignored - your traces are still being captured and sent to Scorecard successfully.View traces in Scorecard
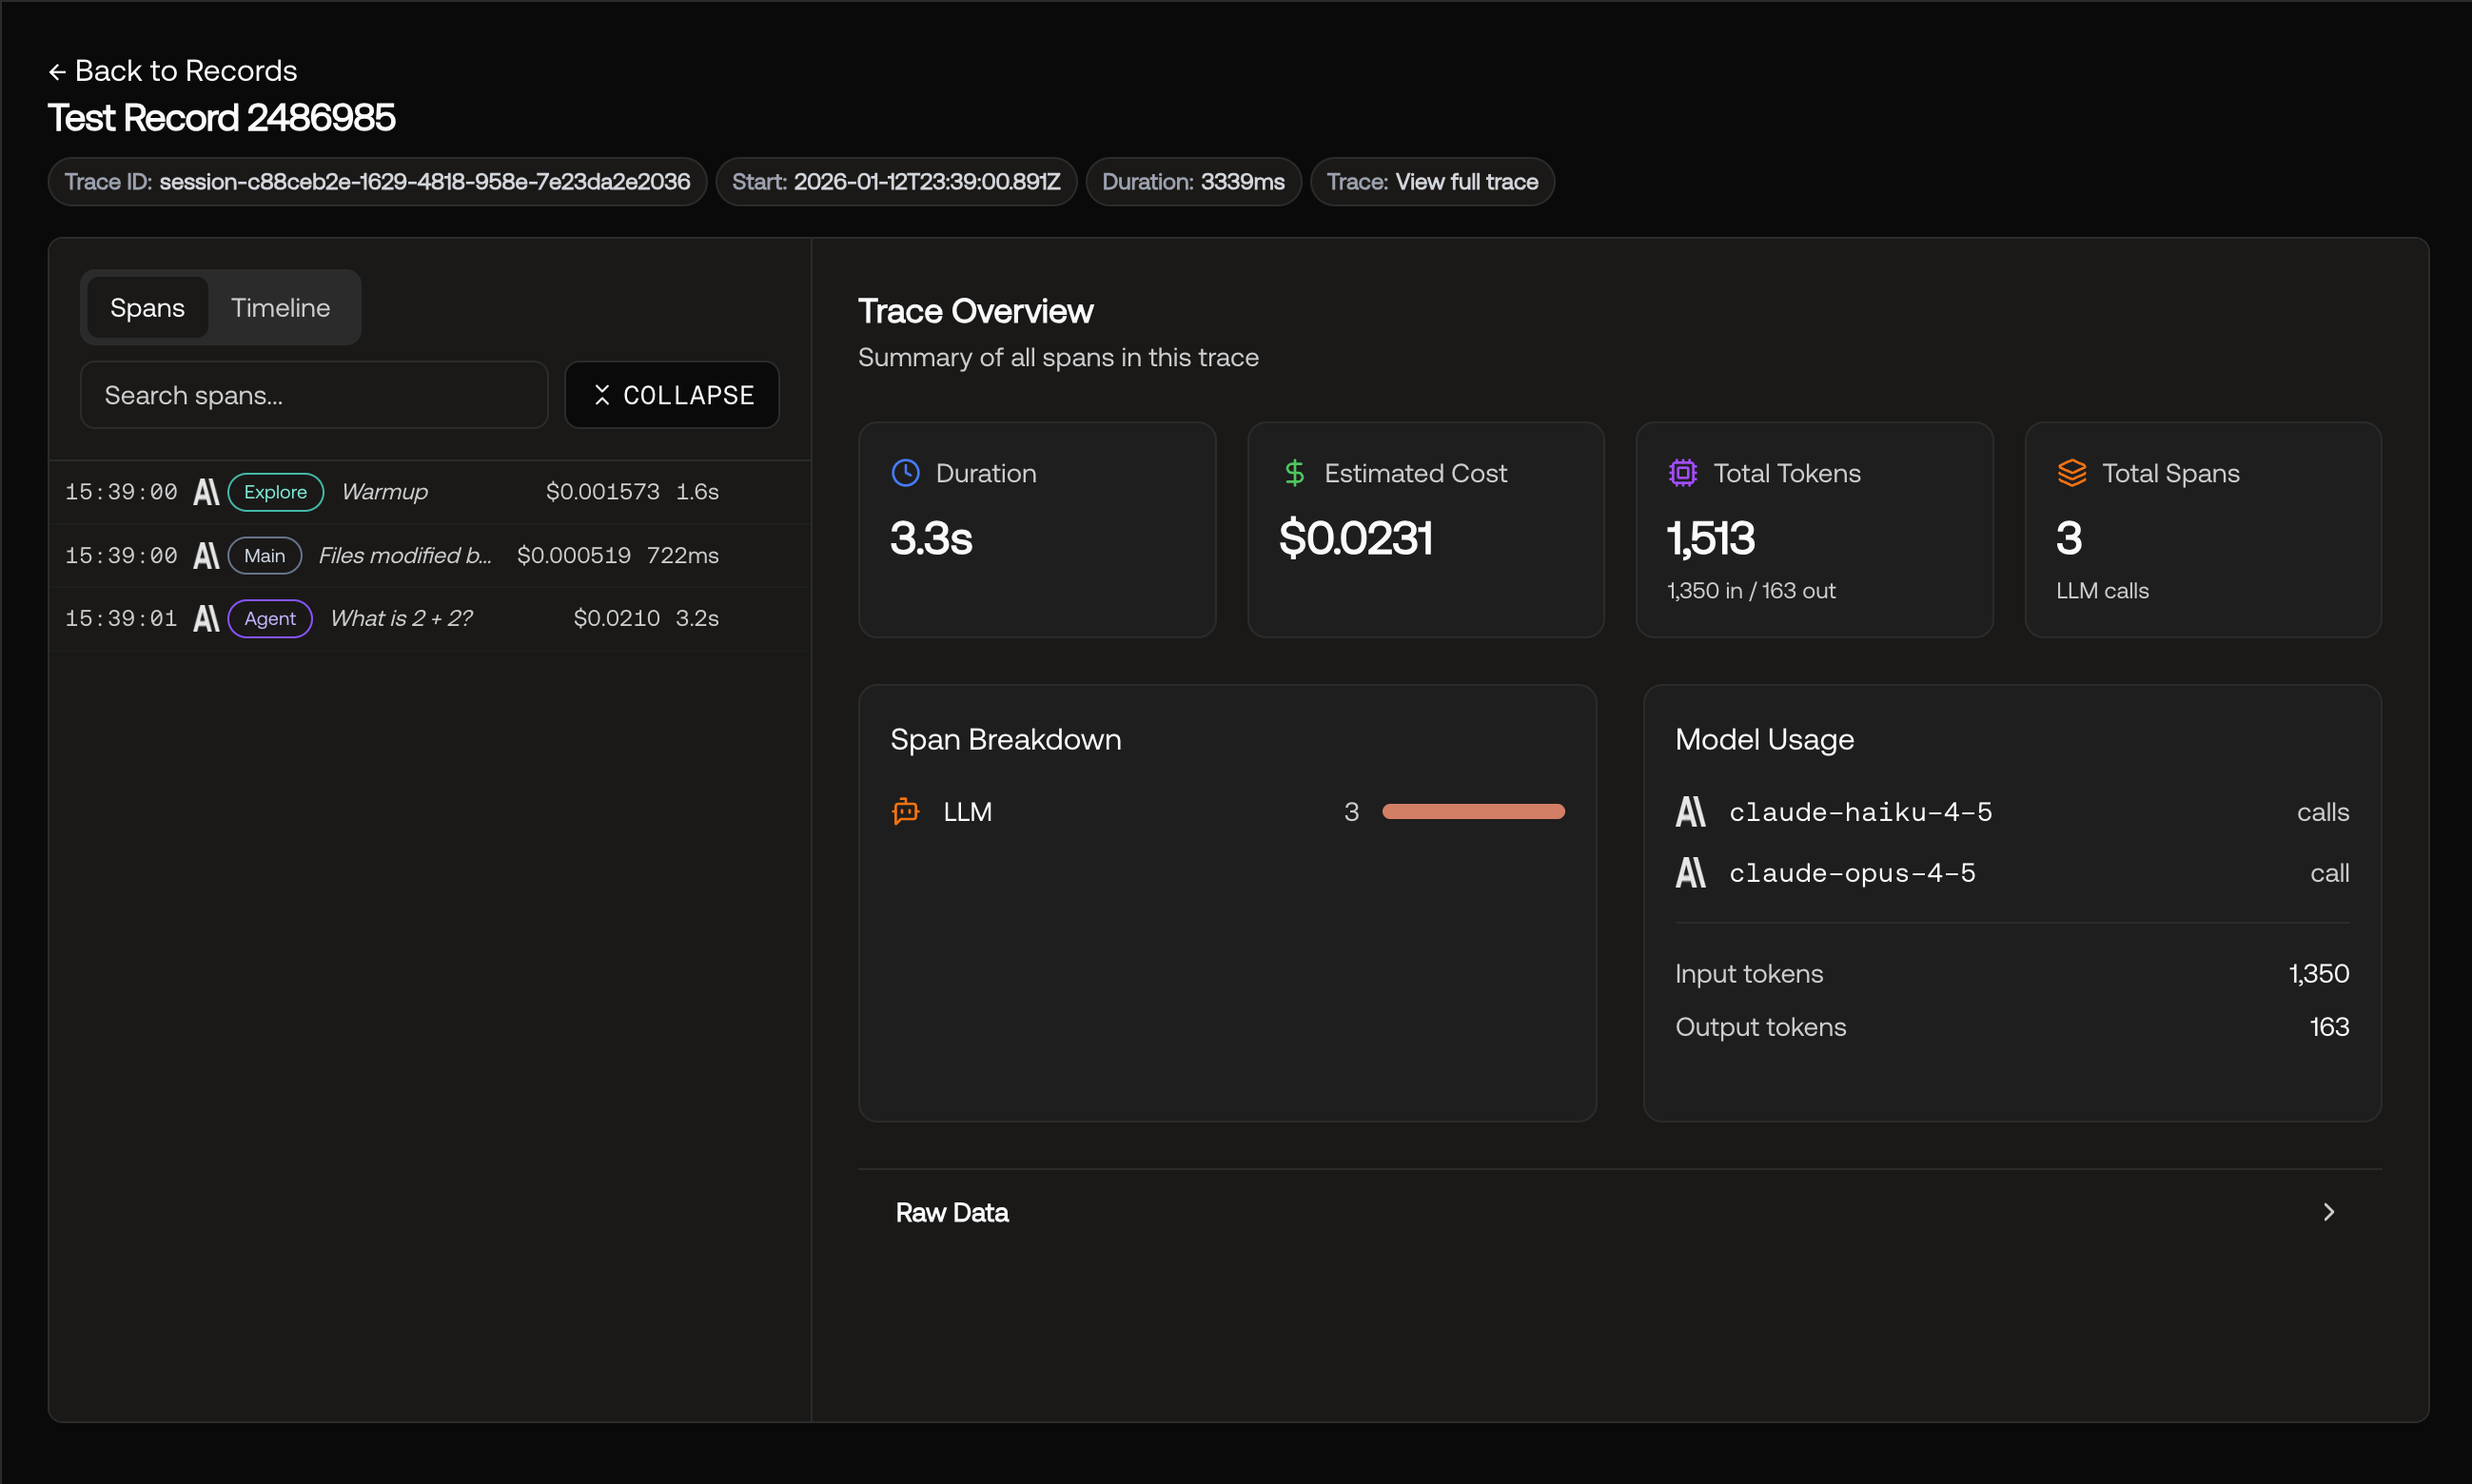
Navigate to the Records page in Scorecard to see your LangChain traces.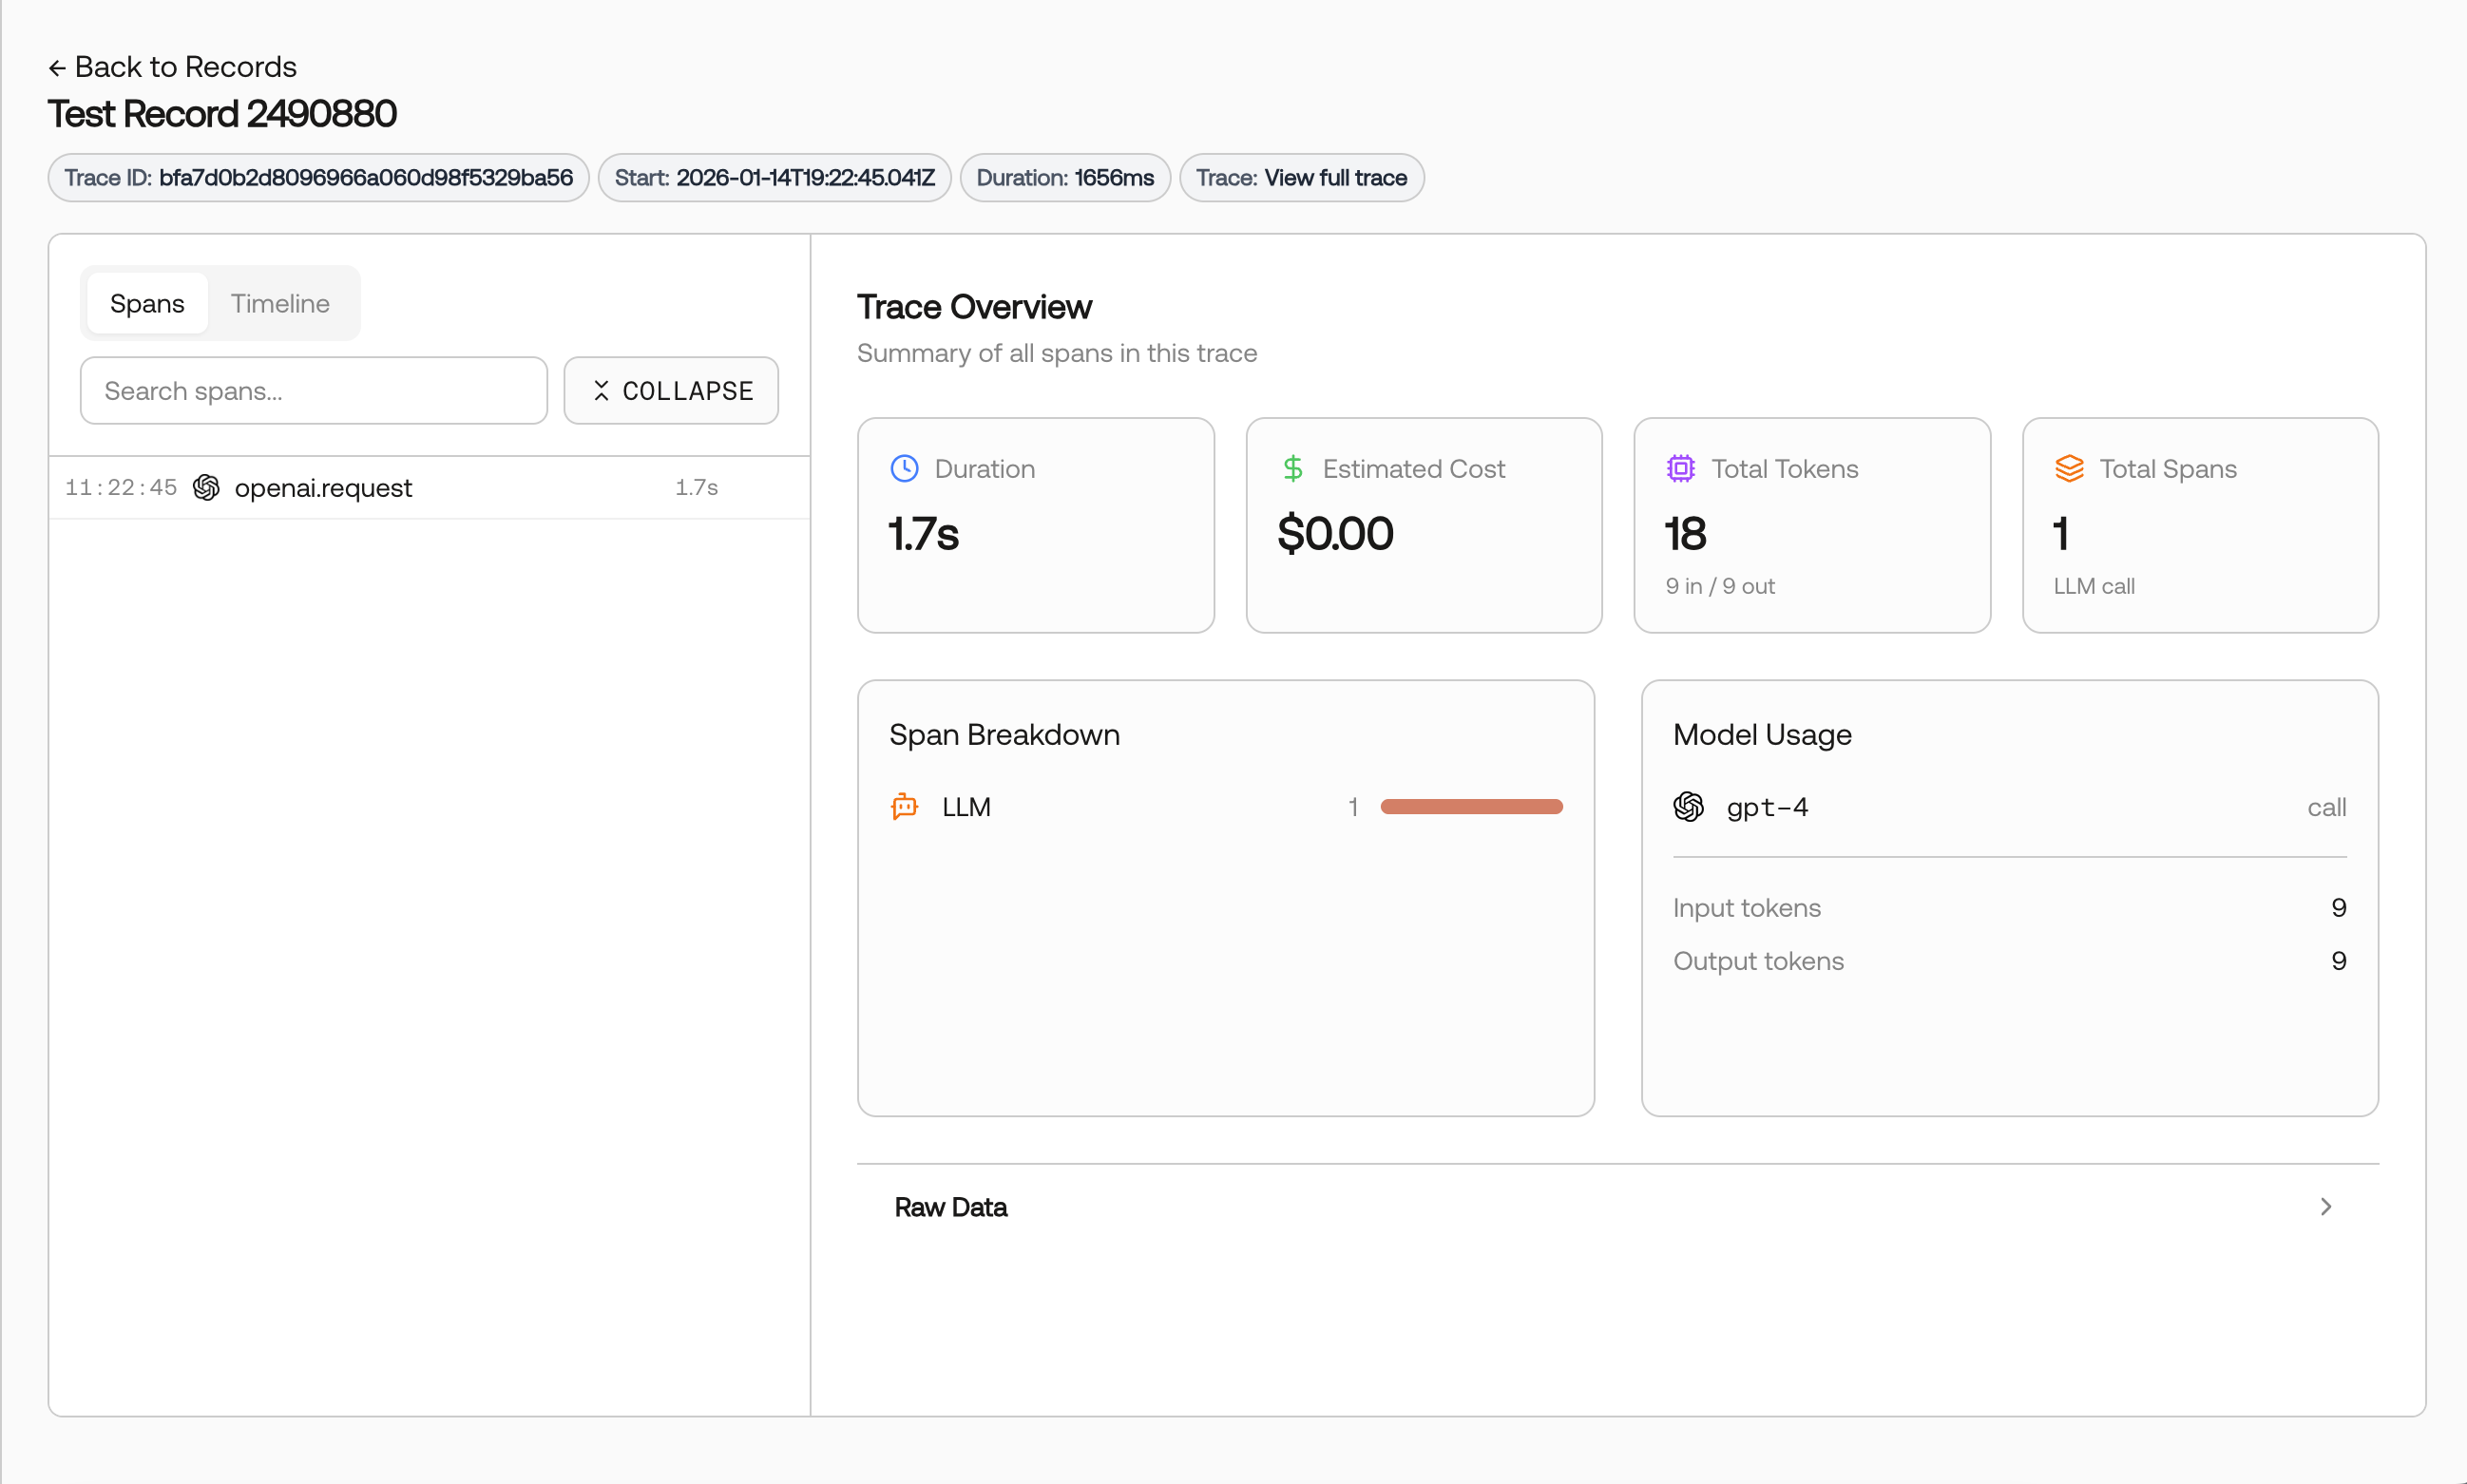
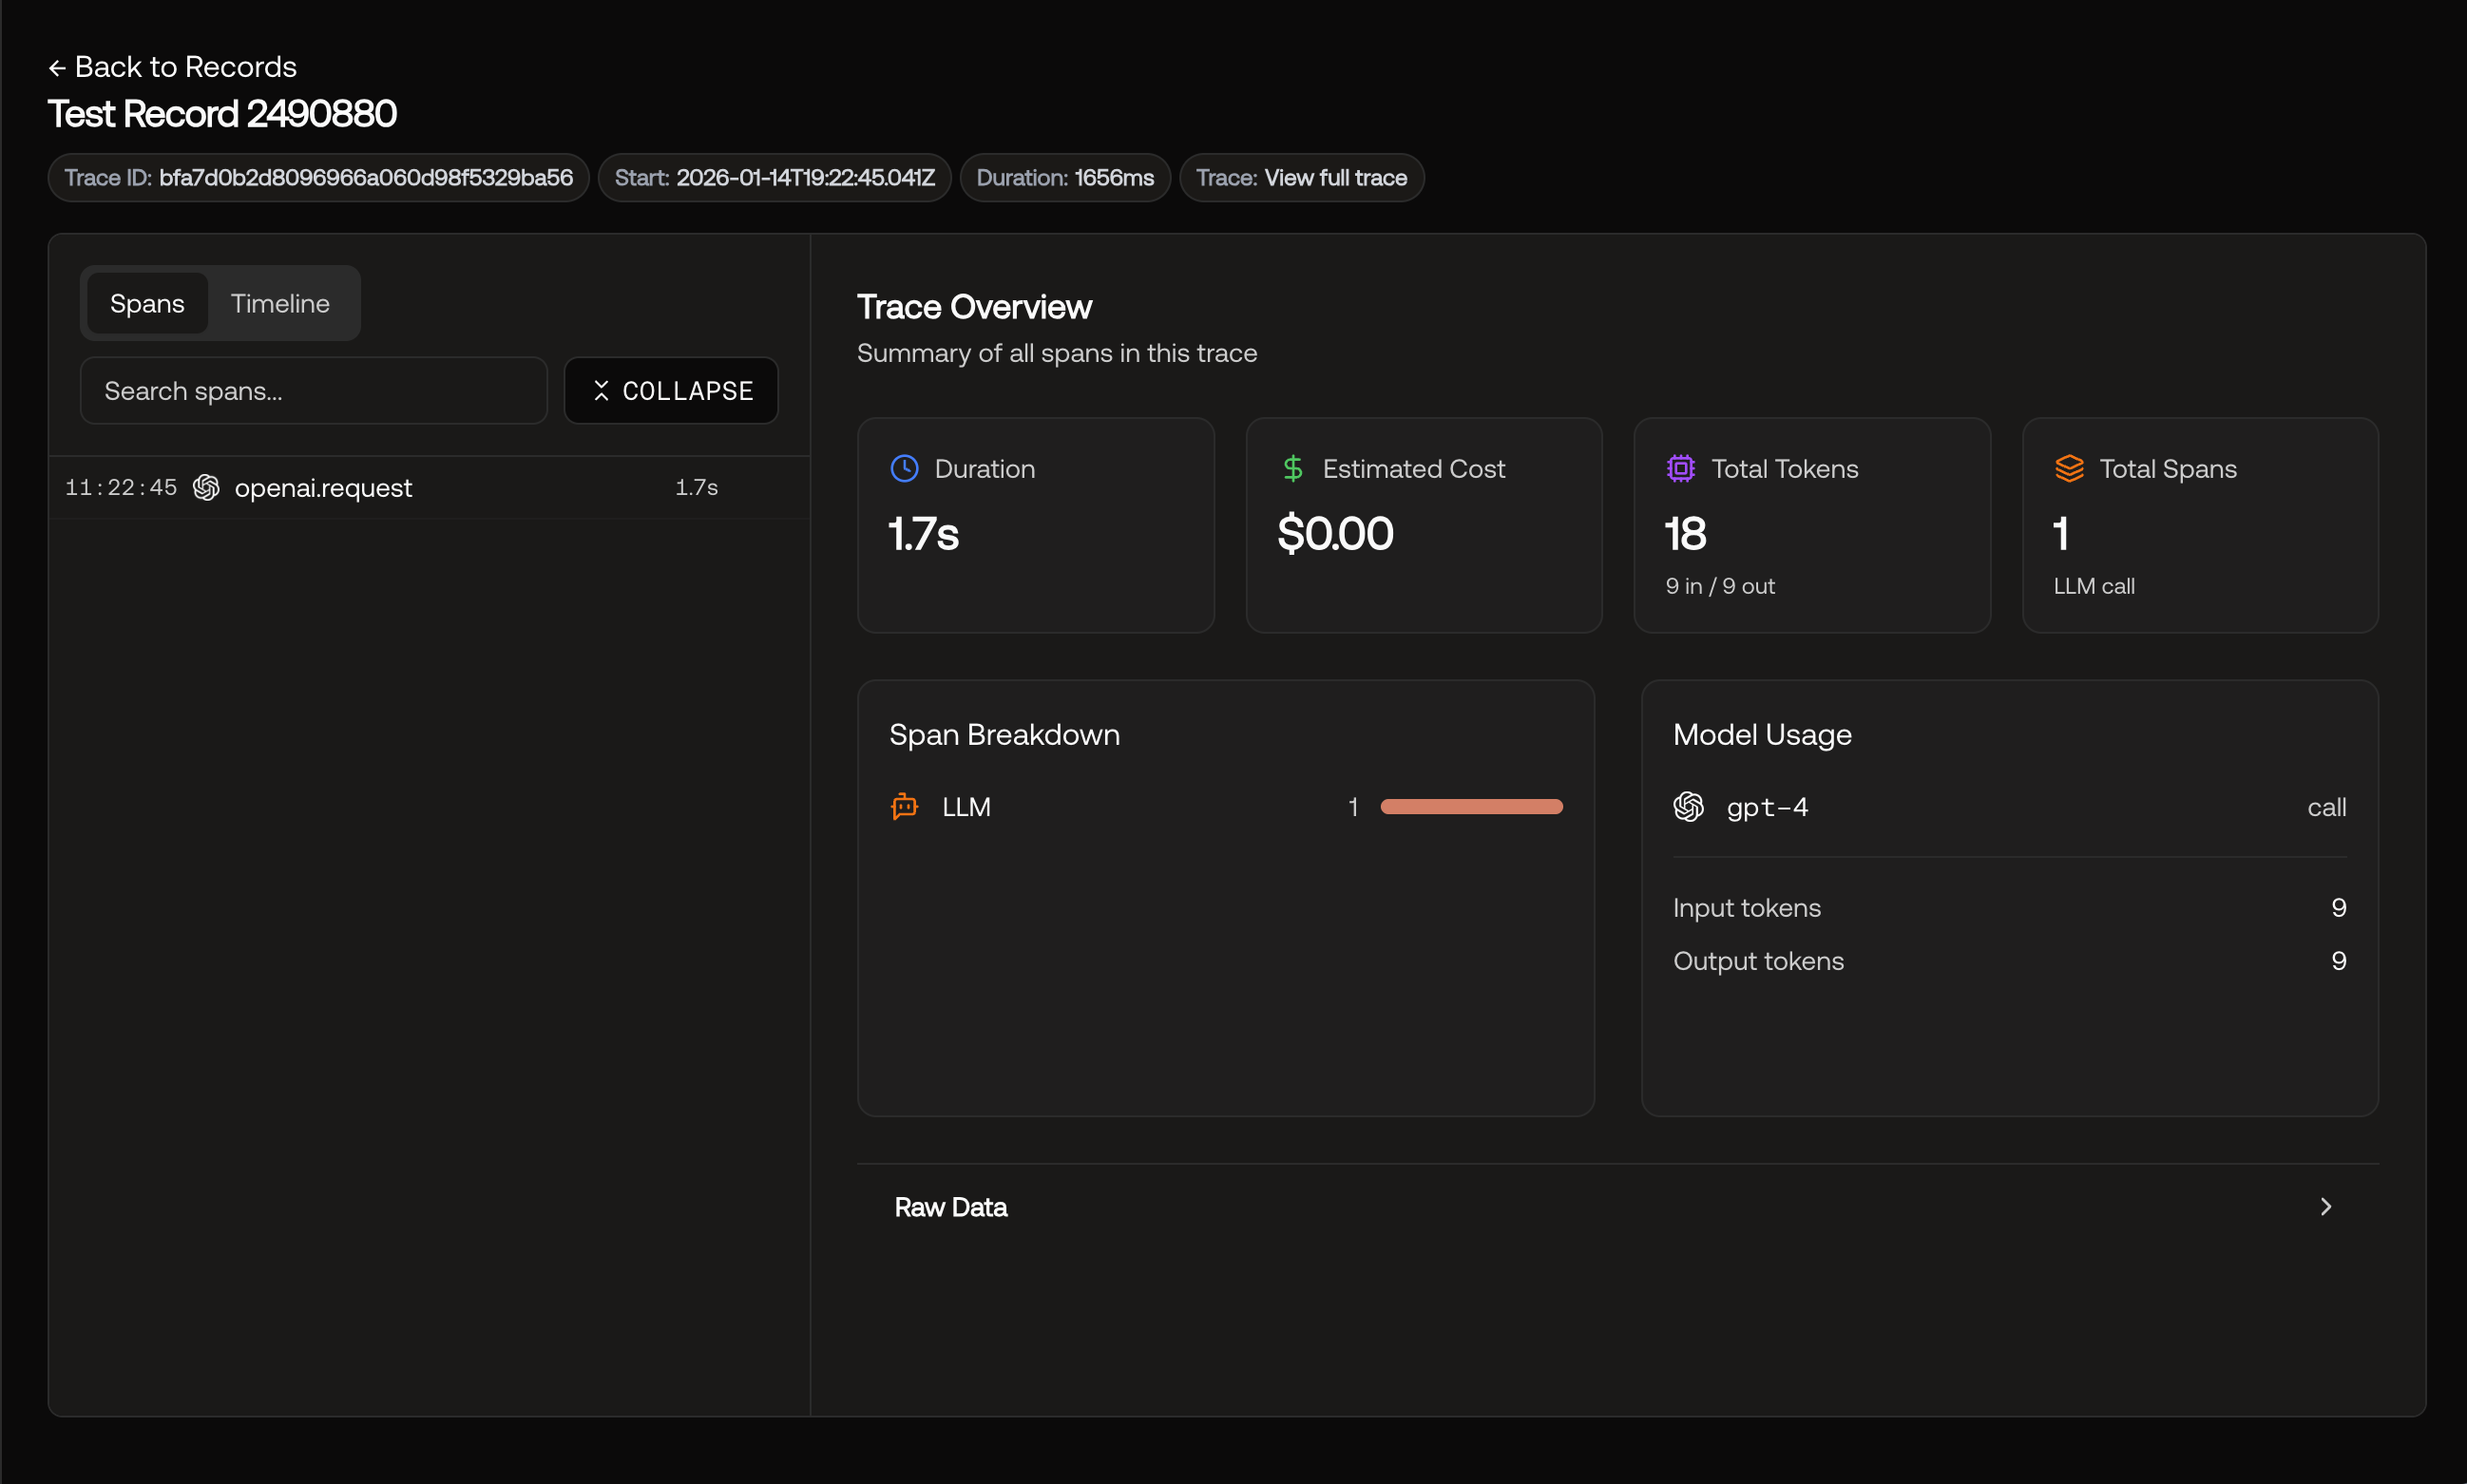 Click on any record to view the full trace details, including chain execution, LLM calls, and token usage.
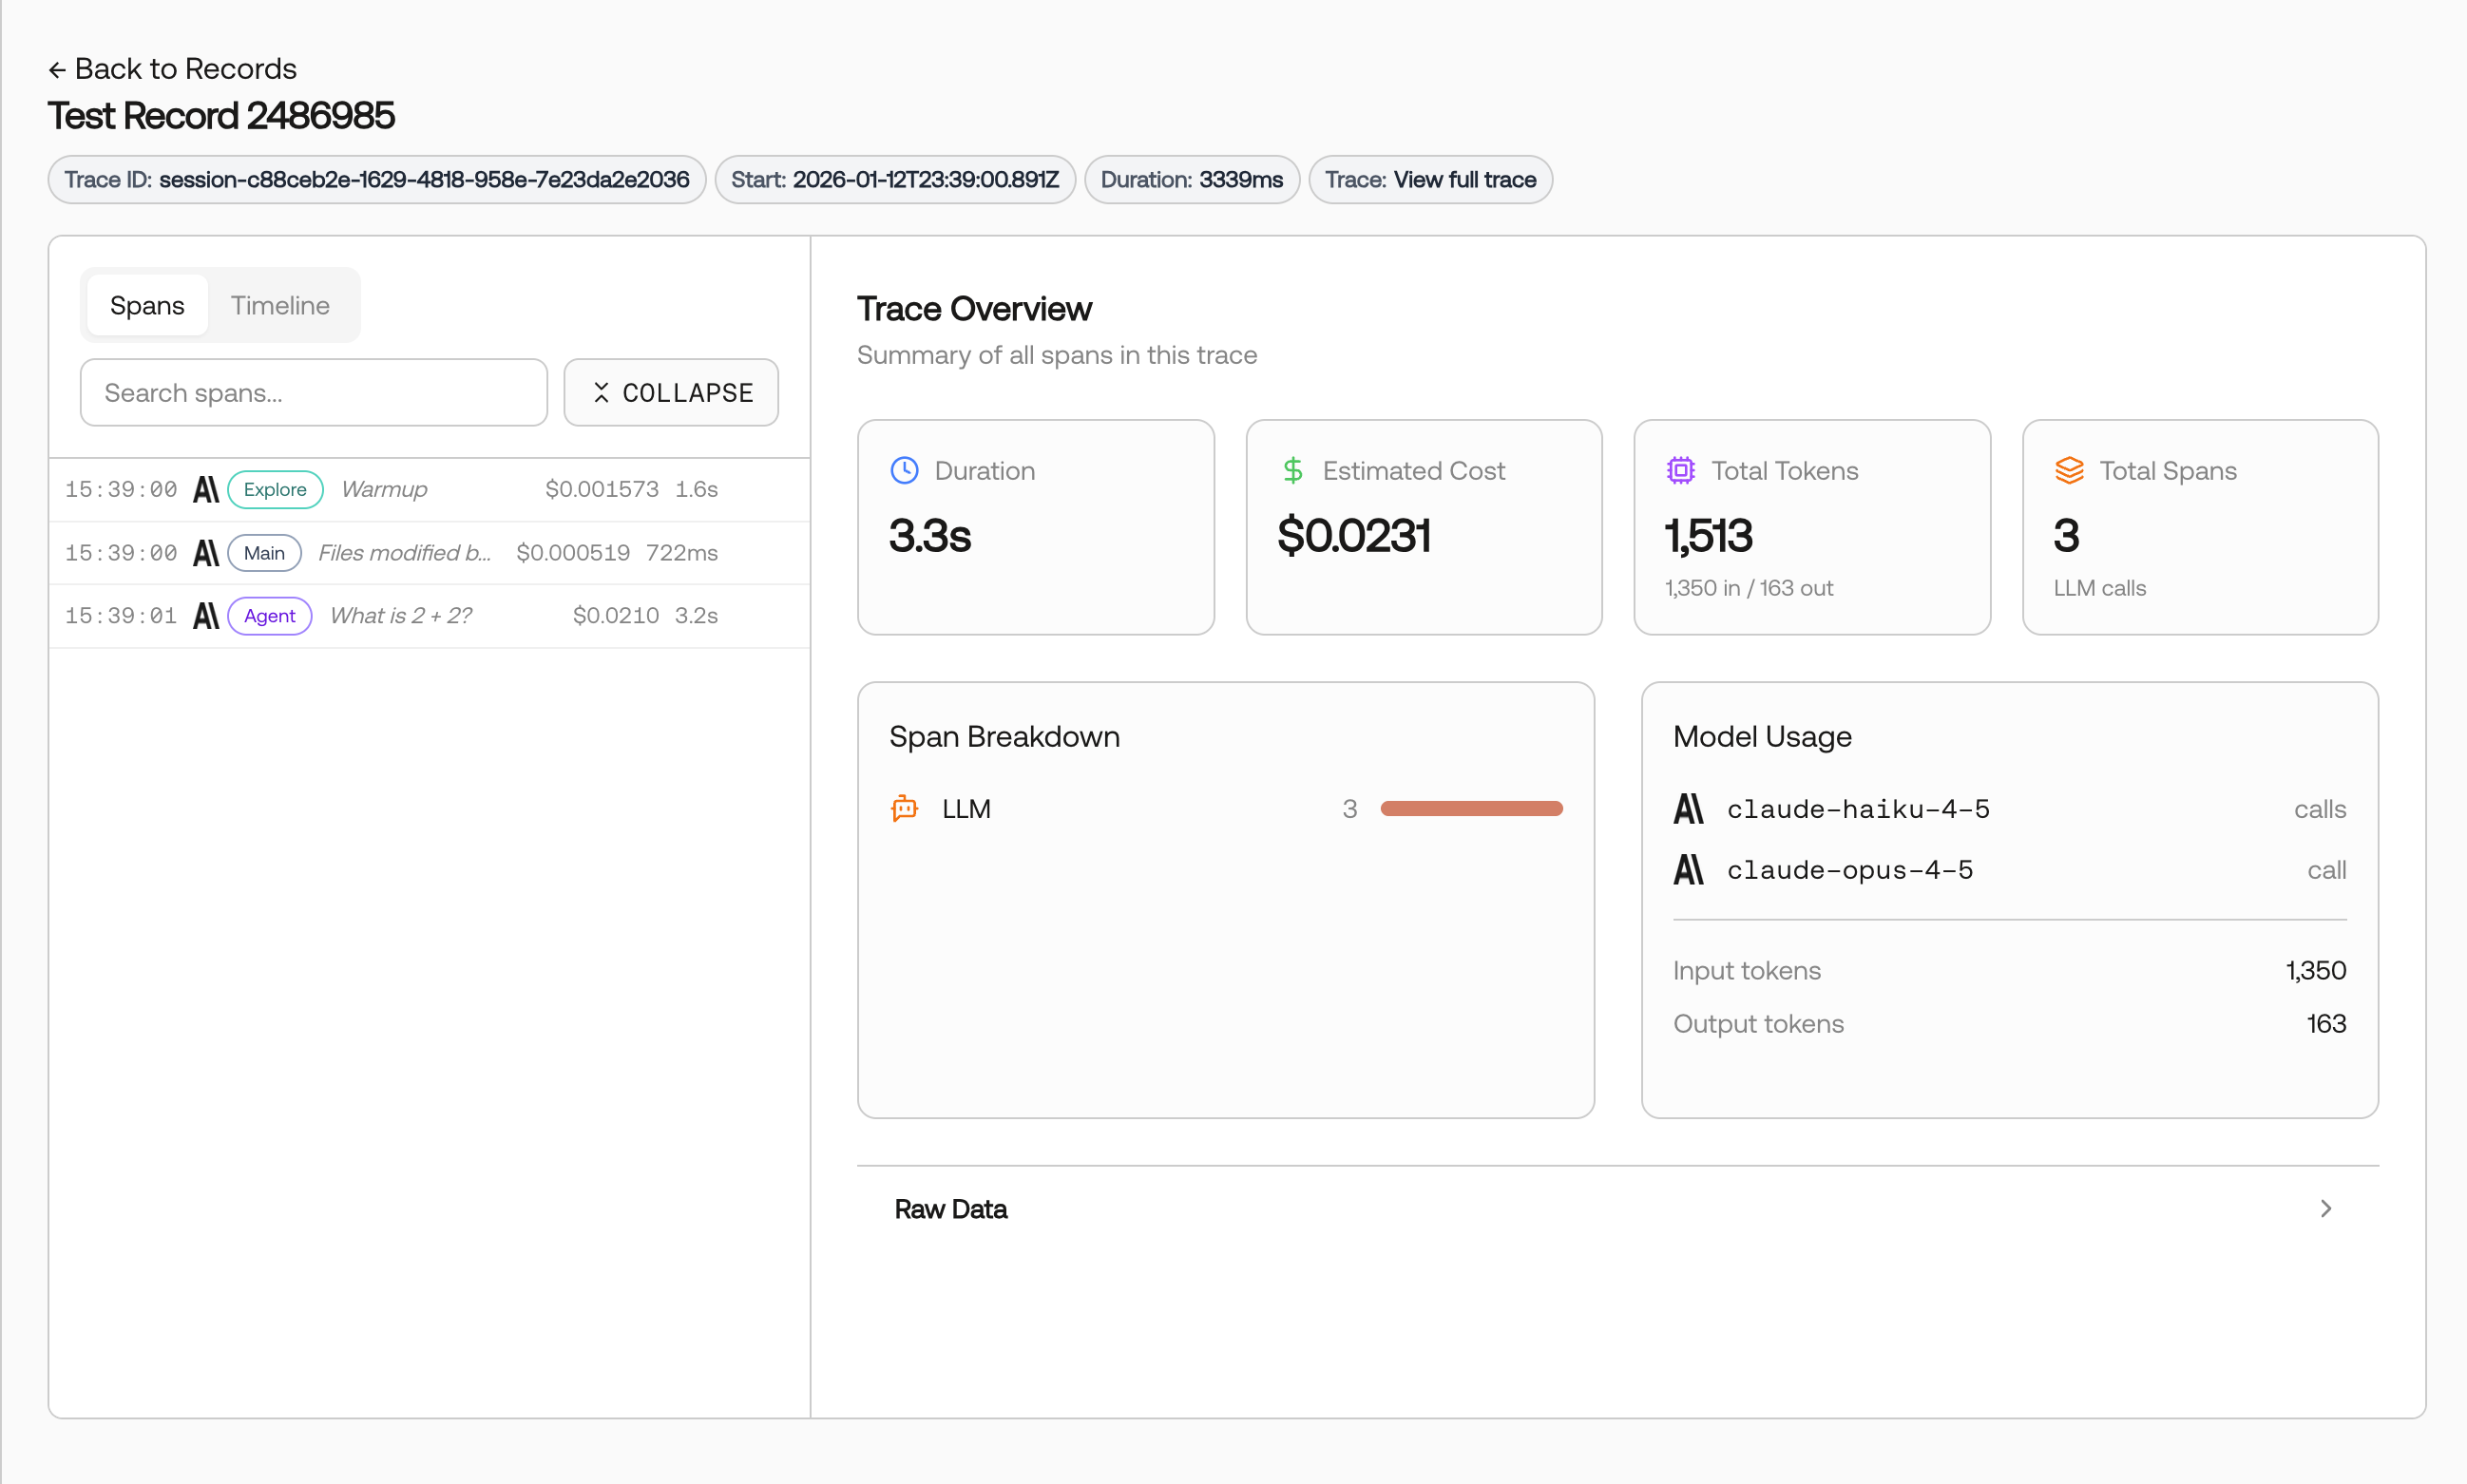
It may take 1-2 minutes for traces to appear on the Records page.
What Gets Traced
OpenLLMetry automatically captures comprehensive telemetry from your LangChain applications. Scorecard includes enhanced LangChain/Traceloop adapter support for better trace visualization:| Trace Data | Description |
|---|---|
| LLM Calls | Every LLM invocation with full prompt and completion, including model information and token counts |
| Chains | Chain executions with inputs, outputs, and intermediate steps |
| Agents | Agent reasoning steps, tool selections, and action outputs |
| Tools | Tool invocations with proper tool call sections (not prompt/completion) |
| Retrievers | Document retrieval operations and retrieved content |
| Token Usage | Input, output, and total token counts per LLM call extracted from gen_ai.* attributes |
| Errors | Any failures with full error context and stack traces |
Enhanced Span Classification
Scorecard’s LangChain adapter recognizes both OpenInference (openinference.*) and Traceloop (traceloop.*) attribute formats:
- Workflow spans (
traceloop.span.kind: workflow) - High-level application flows - Task spans (
traceloop.span.kind: task) - Individual processing steps - Tool spans (
traceloop.span.kind: tool) - Tool invocations with dedicated Tool Call sections - LLM spans - Model calls with extracted model names, token counts, and costs
Tool Visualization
Common LangChain tools receive appropriate coloring and categorization:- Retrievers (retriever, vectorstore, search)
- SQL tools (sql, database)
- Web search (search, google, bing)
- Custom tools - Automatically detected from span names
Next Steps
Records
Learn more about viewing and managing your traced records
Metrics
Create custom metrics to evaluate LangChain application performance